2 hours instead of 8 hours – that was the difference when I built the same Finance dashboards once with standard visuals and once with Zebra BI. And the result was not only finished faster, but also immediately shows where variances occurred, how significant they are, and why. Here are the 4 reasons why I have been using Zebra BI for Finance dashboards in Power BI for 5 years.
4 Times Faster Dashboard Creation
This time I watched the clock very carefully as I built the sample dashboards once with standard and once with Zebra BI visualizations. With Zebra BI visualizations I needed only 2 hours, while standard visuals took a full 8 hours. Why? I had to write 15 more measures to achieve a visually similar result. Unfortunately, the additional measures were not the simplest ones either.
For stable long-term reporting with Power BI dashboards, it is essential for companies to have the in-house expertise to maintain and adapt dashboards. With Zebra BI, many calculations are handled by the visual itself, which massively reduces the complexity of a report.
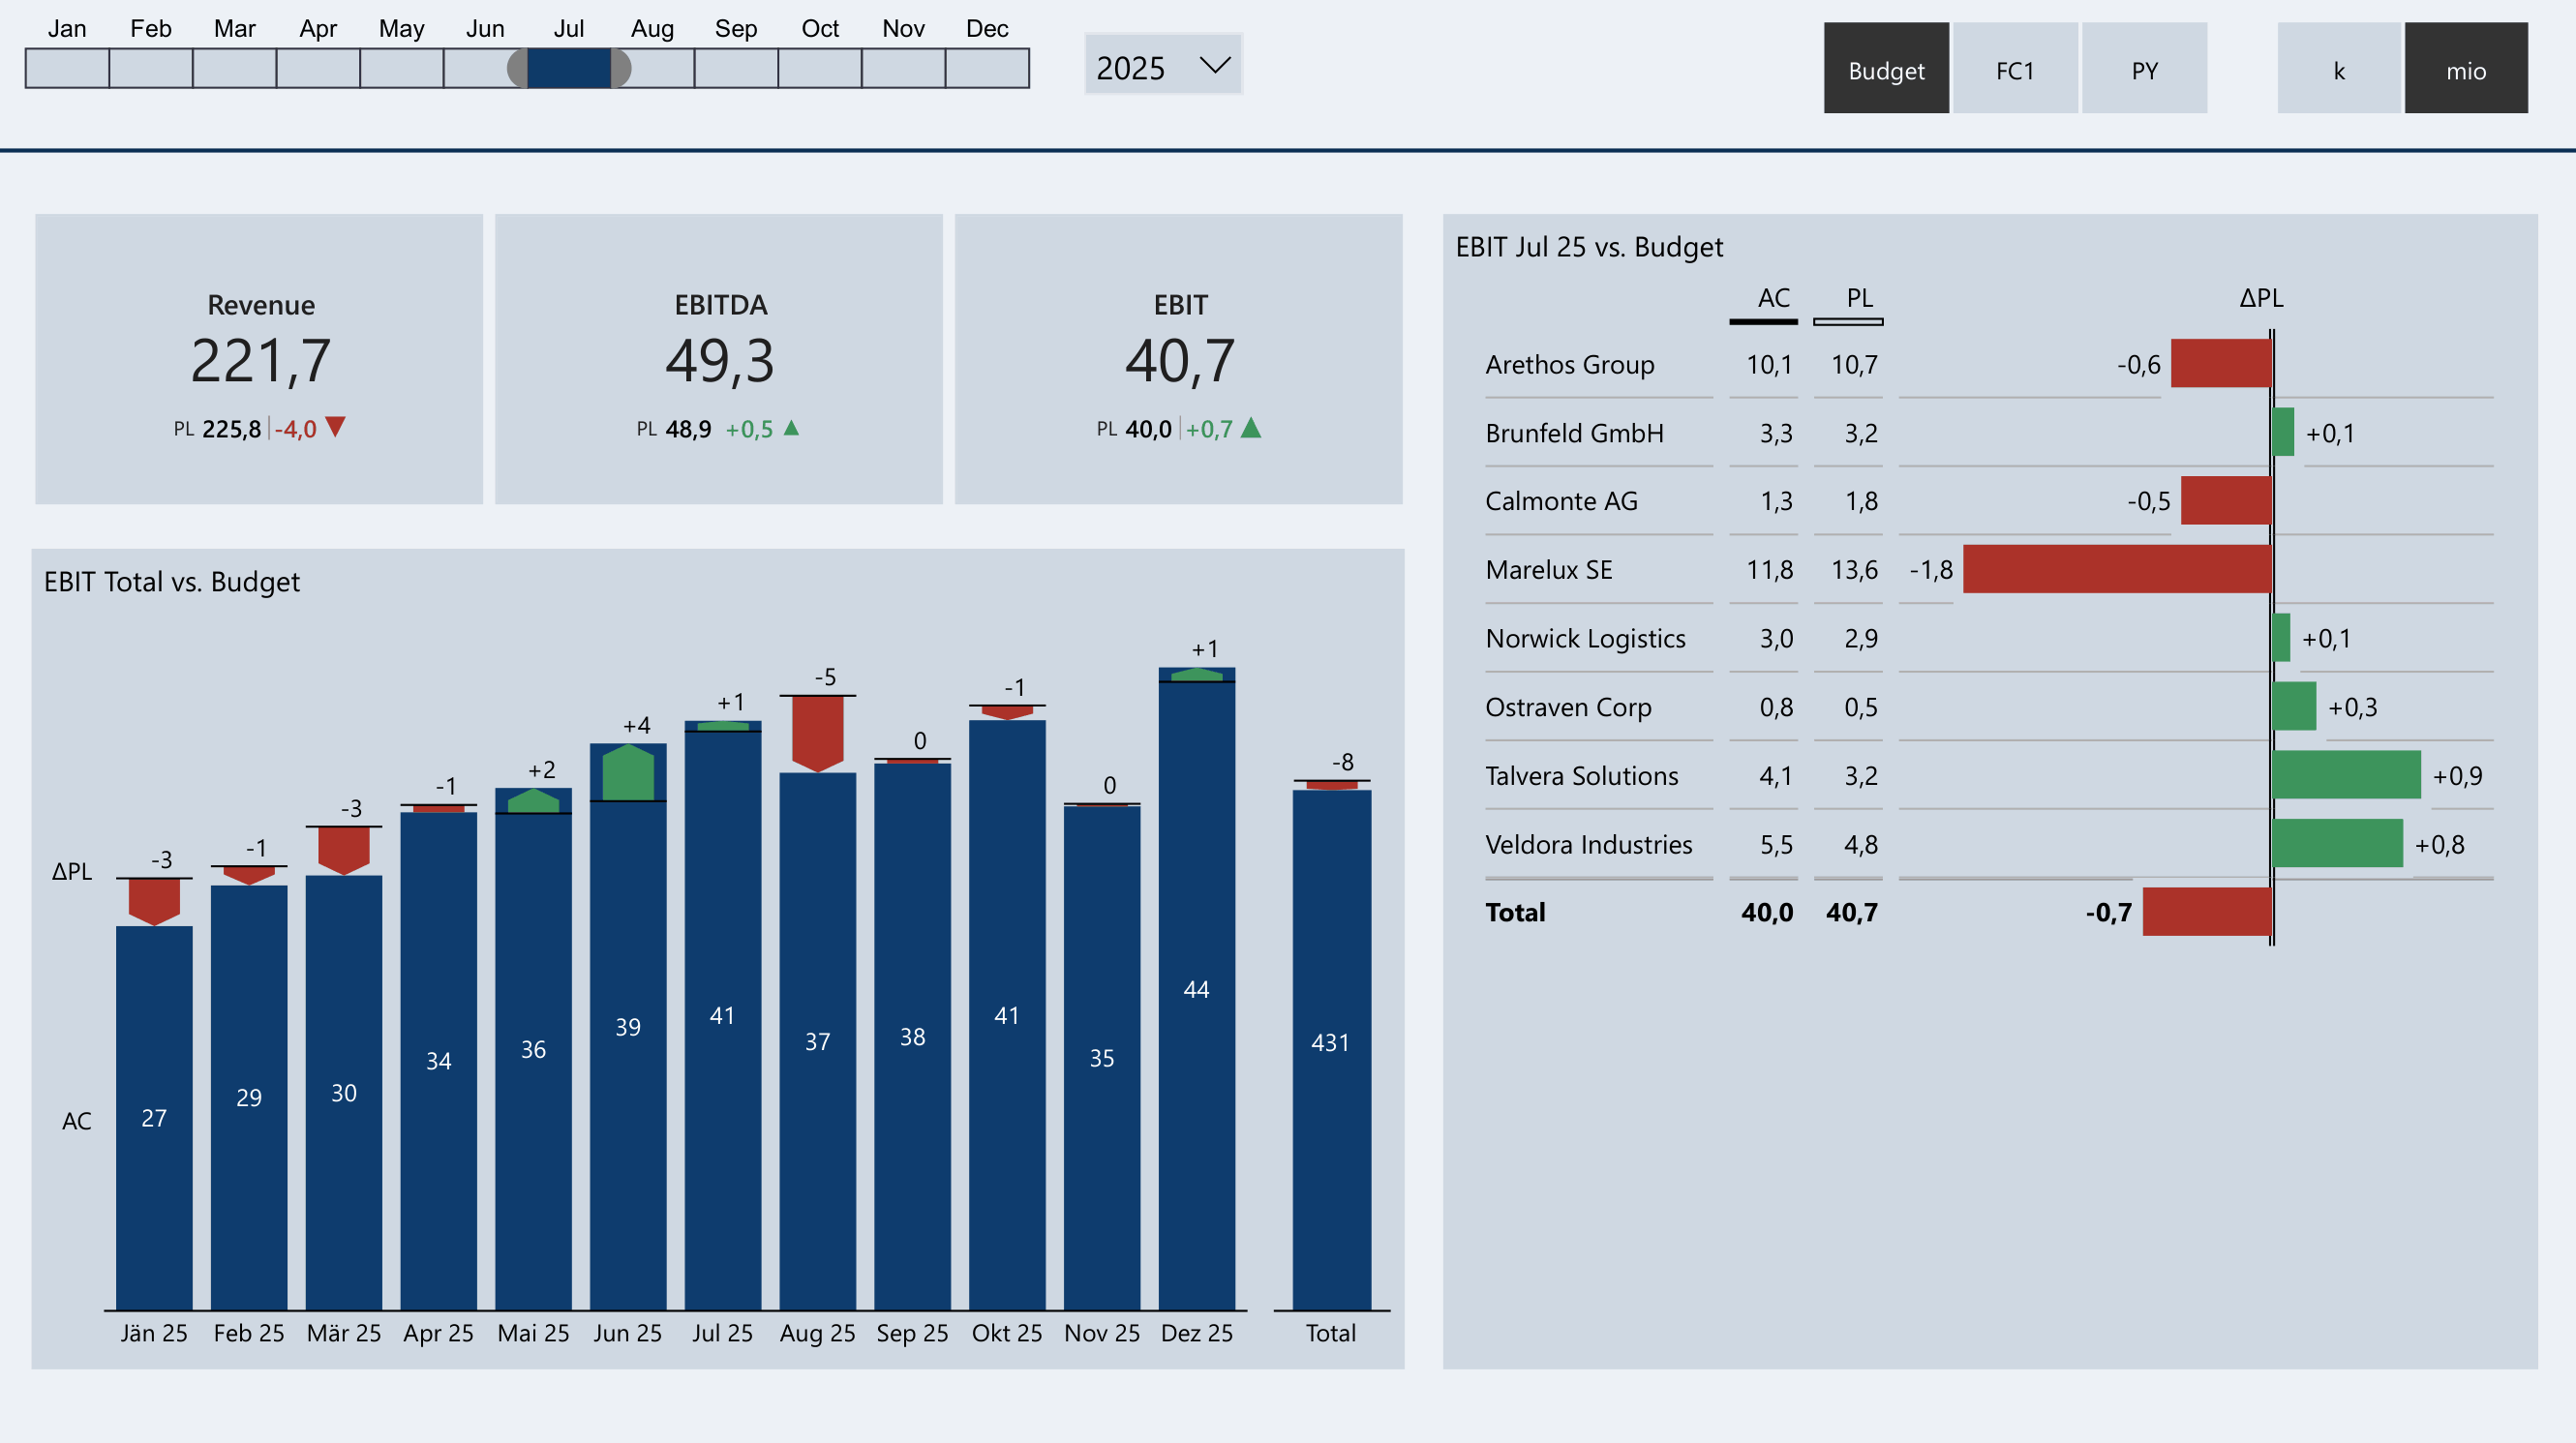
Finance Dashboard Overview – built with just a few base measures directly in Zebra BI
Clear Display of Variances from Multiple Plan Versions
In truly good controlling dashboards, the magnitude and direction of the variance from budget or forecast are clearly visible. There is also the option to compare the annual budget and short-term forecasts with each other, providing a better understanding of the further course of the year. In some cases this can be solved with many workarounds using standard Power BI visuals.
The green or red area between AC and PL or PL and FC makes the variance direction readable at a glance – even without reading the numbers.
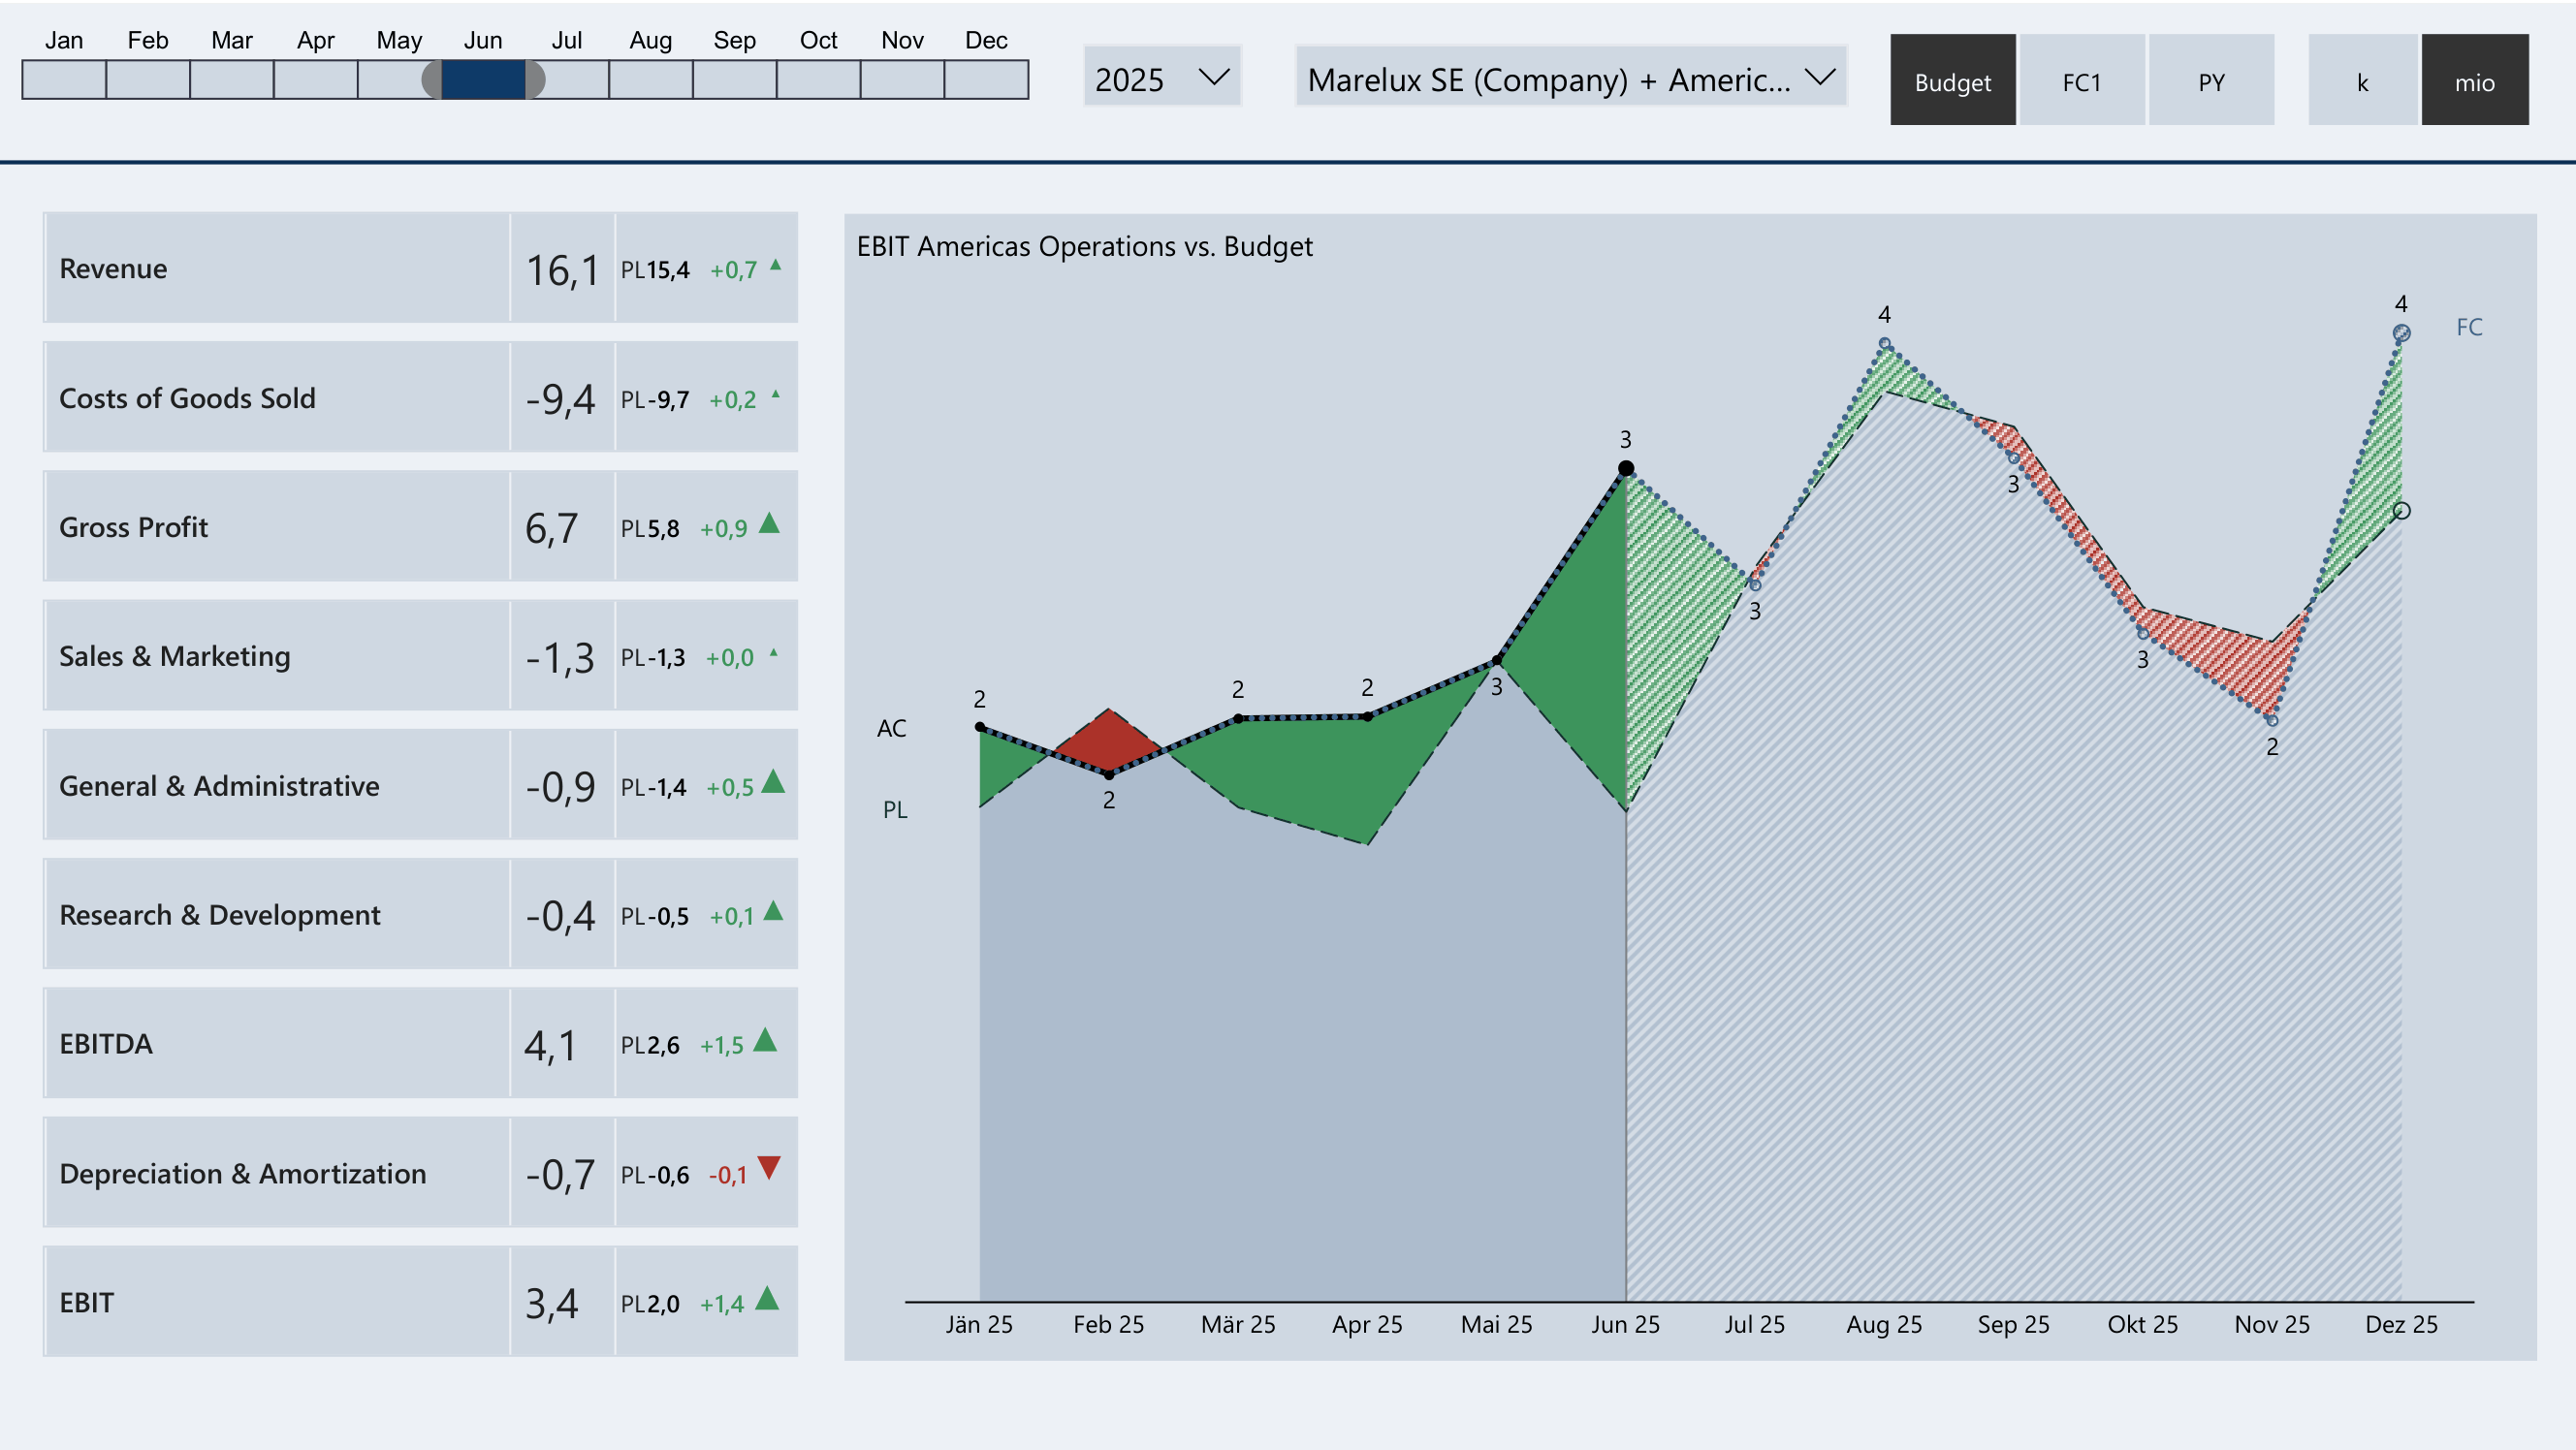
Budget, Forecast and Actuals over the year – AC/PL/FC comparison at a glance
Simple Waterfall Charts
The success of transforming reporting to Power BI dashboards also depends on whether the dashboard shows why variances occurred. The best-suited visualization for variance analyses is waterfall charts. In no other form of representation does it become so clear how a result came about.
Bringing the standard waterfall visual to a good level requires a lot of complexity and time. Zebra BI solves this with a full-featured waterfall that works without workarounds. The "Others" function allows you to freely choose the number of displayed items – the rest is automatically bundled. This keeps the waterfall readable even with complex cost structures.
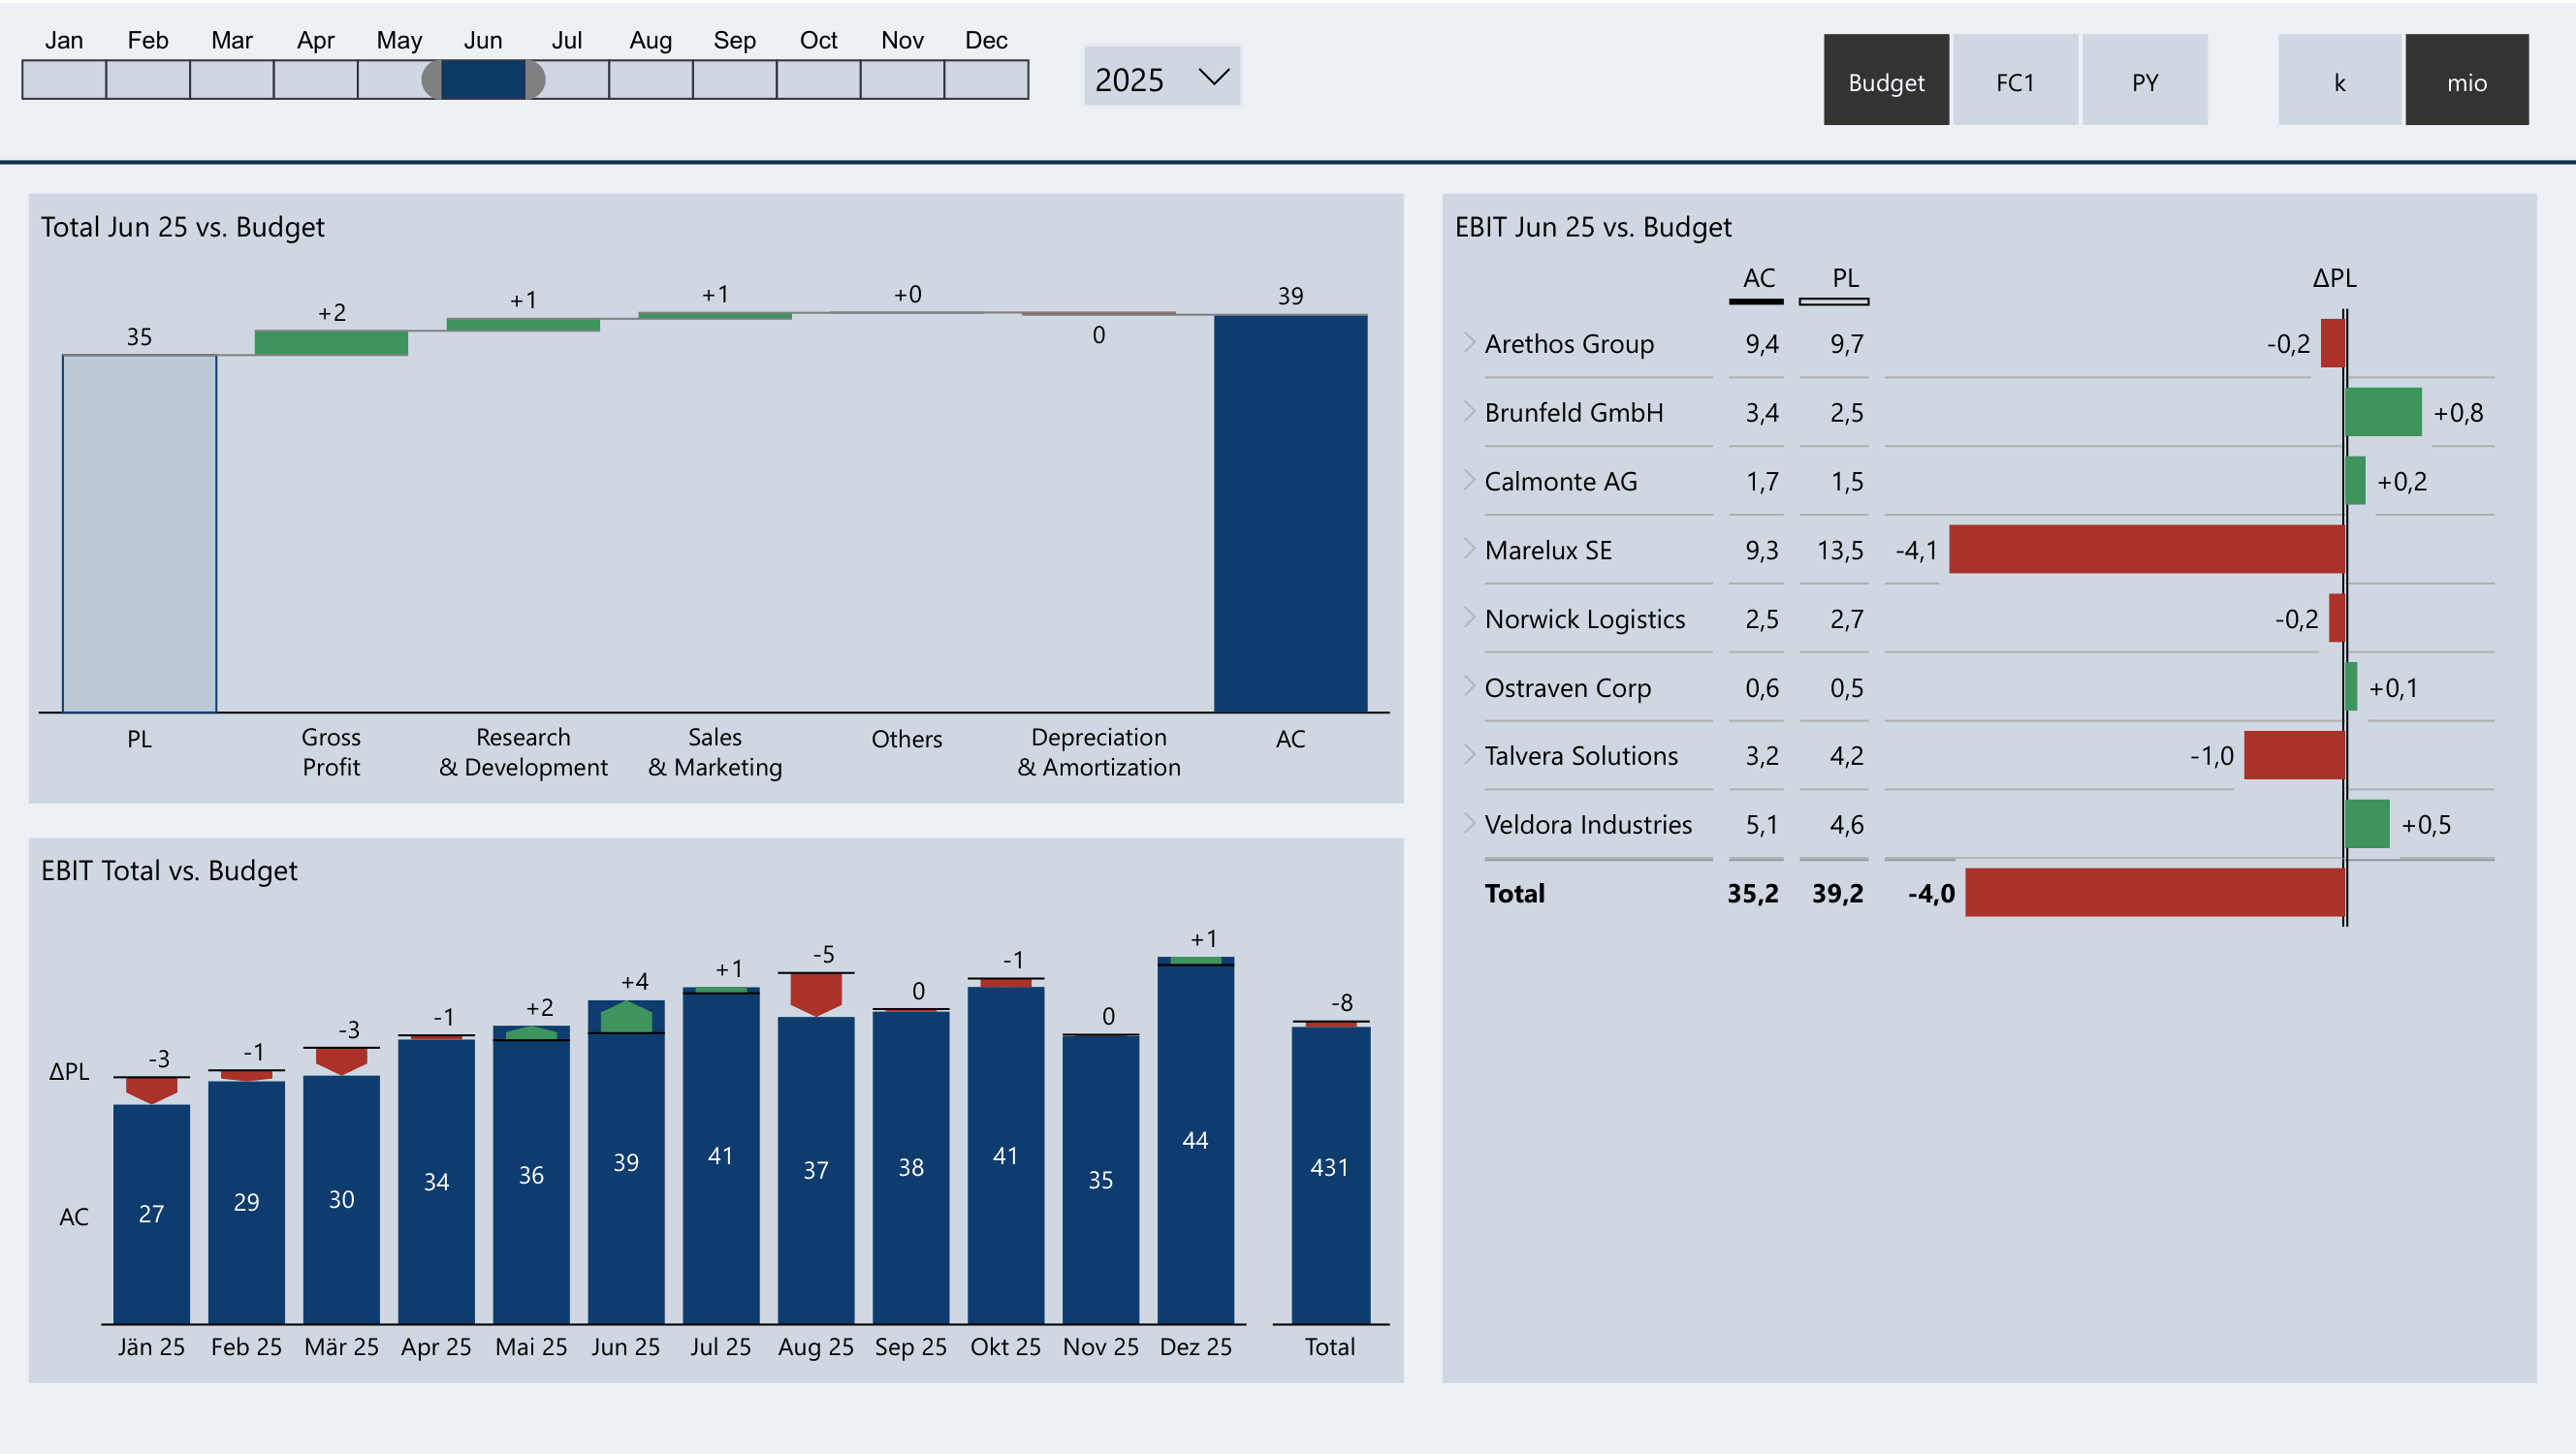
Variance Analysis P&L Items – Waterfall with automatic Others bundling
Comment Display
However, some business events cannot be found in even the best data and dashboards. The controller also needs an easy way to add manual comments to a dashboard. There are countless variants for displaying comments, such as mouse-over tooltips, text boxes, or tables.
No approach, however, is as convenient for the user as the comment box from Zebra BI Charts. As visible in the dashboard, the comment box shows not only the text, but automatically also the variance amount and direction – directly next to the respective bar.
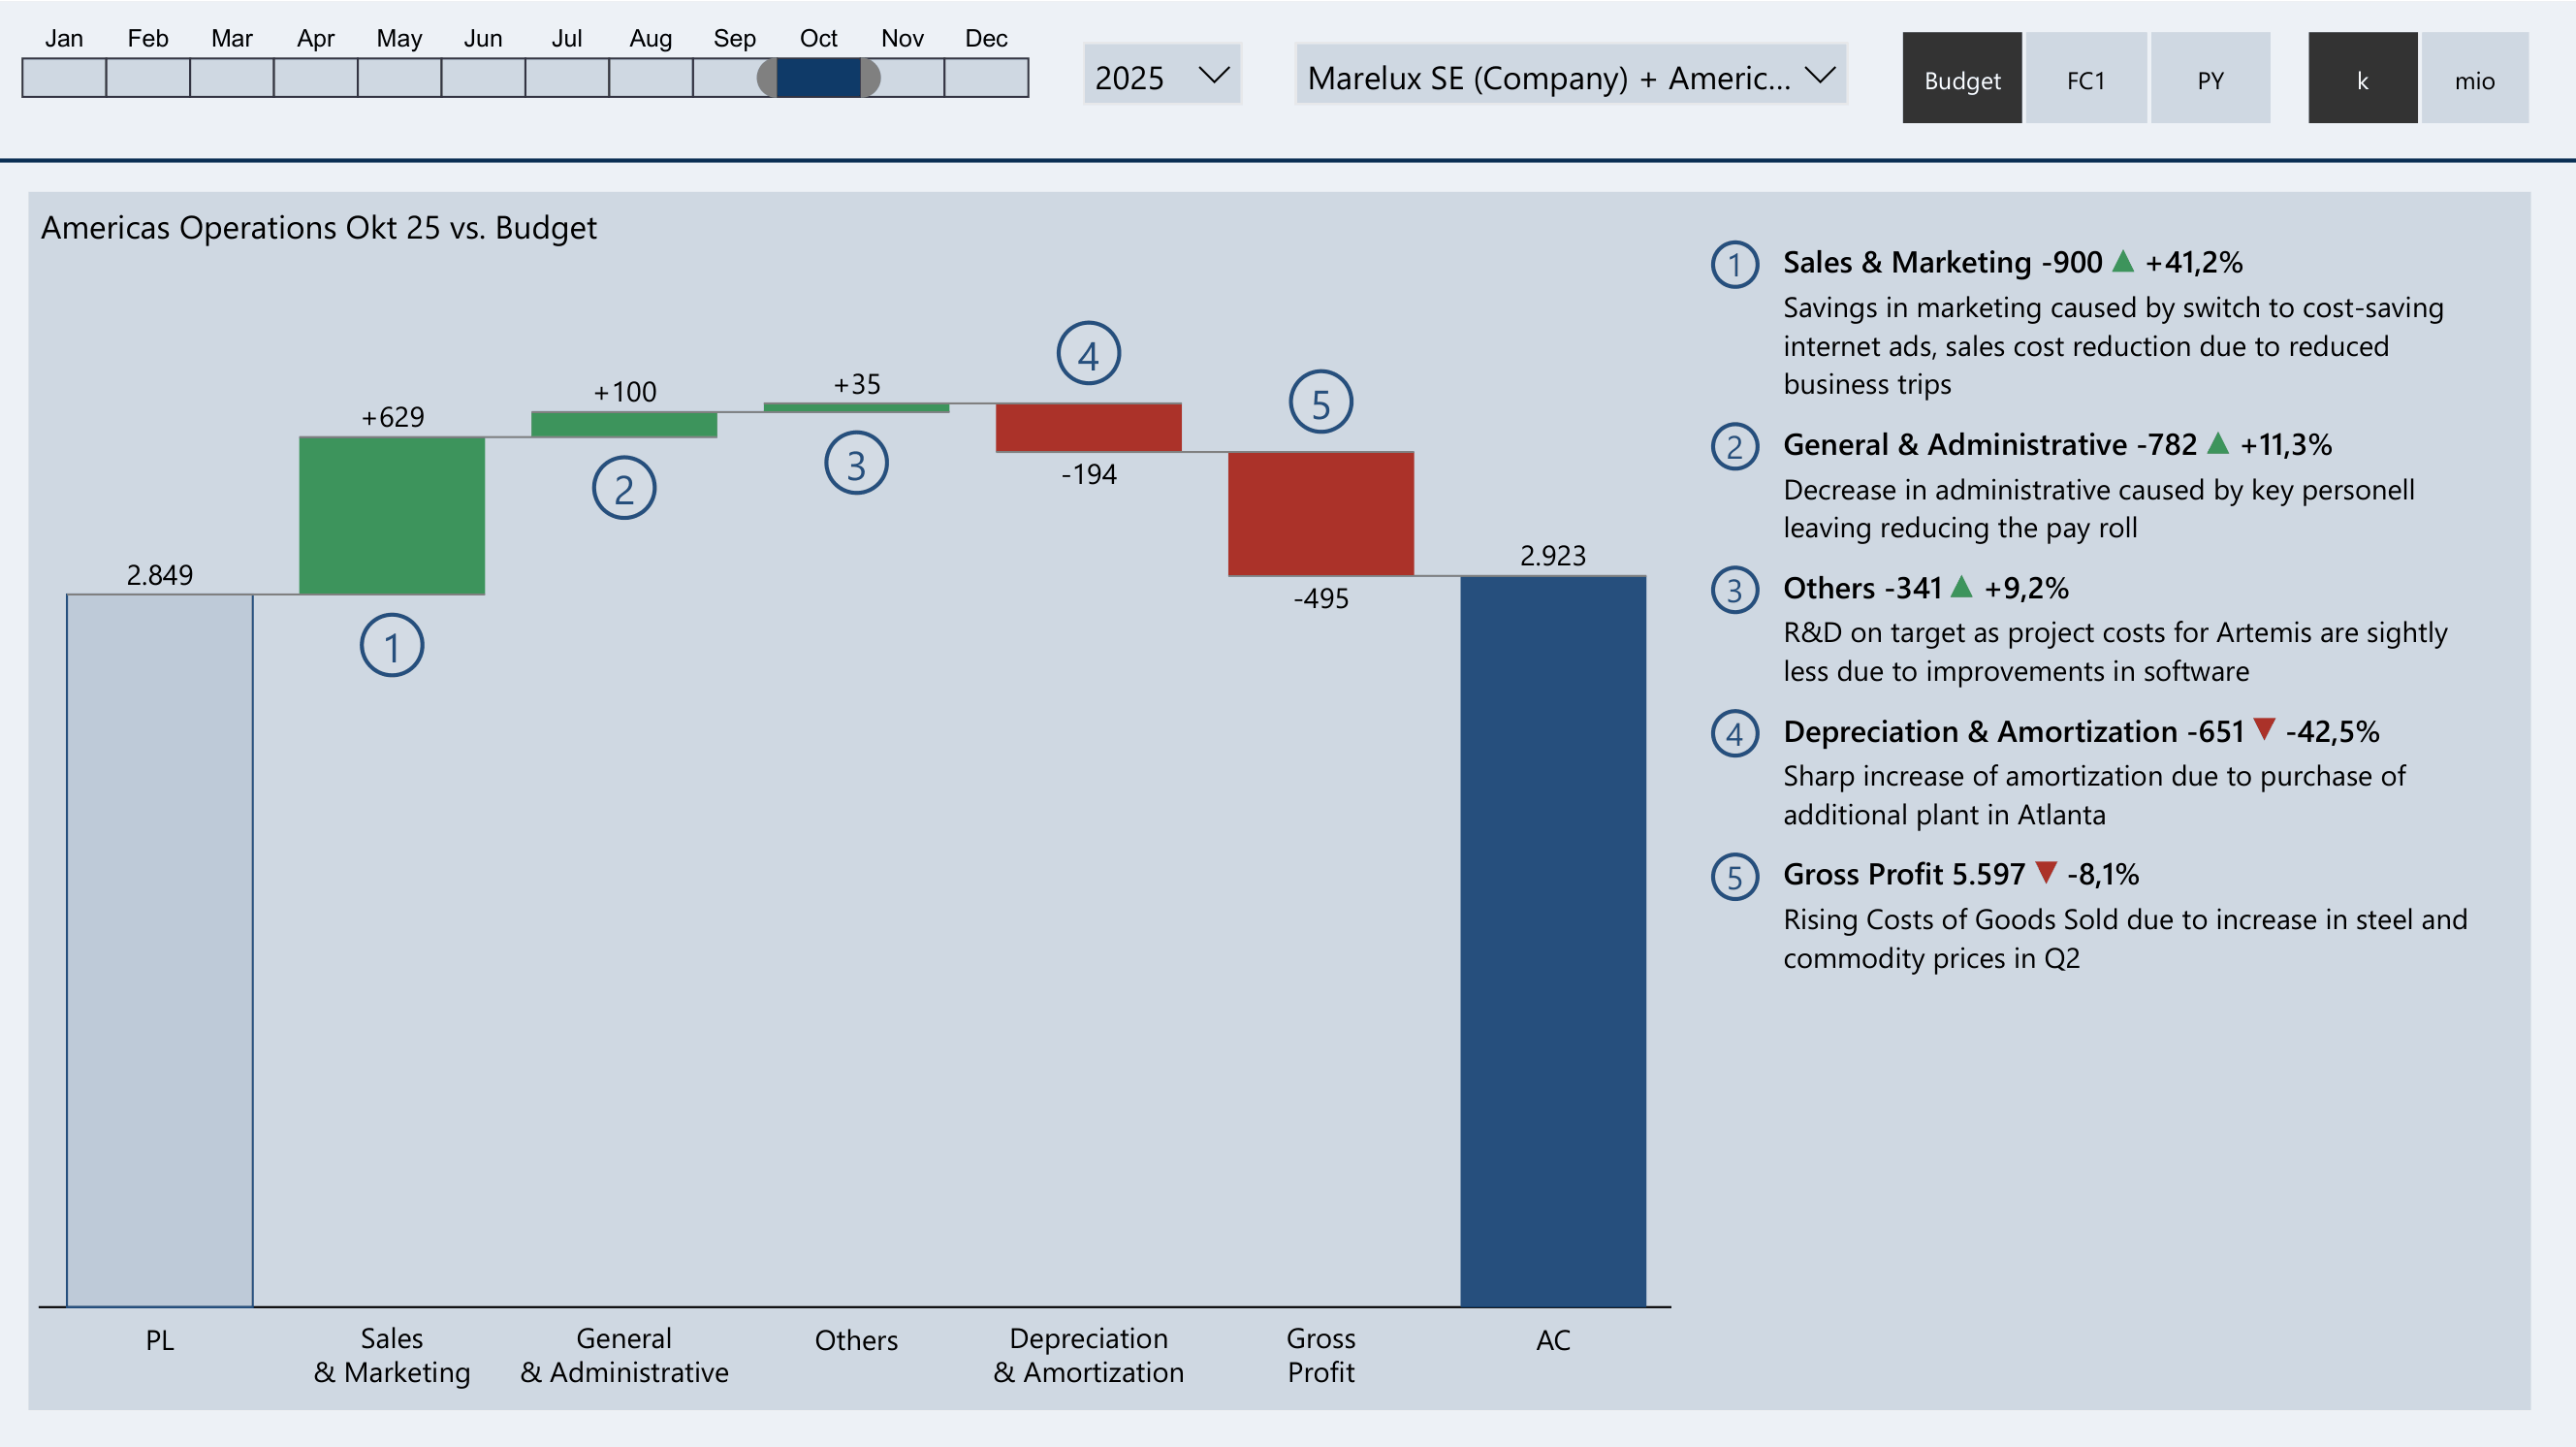
Comment box directly next to the bar – variance amount and direction automatically displayed